Rising geopolitical tensions between Israel and Iran have prompted a global risk-off sentiment, impacting risk-on assets including Bitcoin (BTC). The leading cryptocurrency has declined 1.7% in the past 24 hours but technical indicators suggest a potential new all-time high (ATH) in the near future.
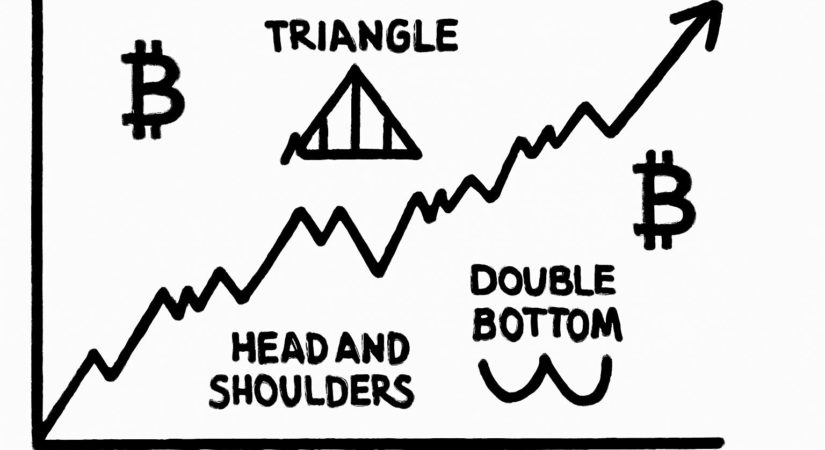
Crypto analyst Titan of Crypto recently highlighted on X that Bitcoin is tracing an ABCD chart pattern while trading within a wedge formation. If BTC breaks out from this wedge, it could target up to $137,000. The ABCD pattern consists of four points and three legs (AB, BC, CD), where AB and CD are often equal and BC is a retracement, indicating possible price reversals.
Other analysts also point to bullish signals for Bitcoin’s recovery. Crypto Caesar identified a bullish double bottom on the 4-hour chart, suggesting further upward momentum. Additionally, Jelle observed a cup and handle pattern on the daily chart, with the handle formation indicating a potential sharp price increase.
On-chain analyst Merlijn the Trader referred to the Hash Ribbons indicator, which tracks Bitcoin’s 30-day and 60-day hash rate moving averages to detect miner capitulation and recovery. Historically, this signal precedes significant rallies, strengthening the case for an upcoming uptrend.
However, bearish signs are emerging as well. Bitcoin has repeatedly failed to surpass the $110,000 resistance, giving short-term sellers some control. On-chain data shows long-term holders reducing their positions, a behavior typical near the end of bull cycles. Meanwhile, short-term holders’ confidence appears to be waning, reflected in recent trading activity.
At the time of reporting, Bitcoin trades around $105,568, down 1.7% in the last 24 hours, maintaining levels above the key $100,000 threshold.
